
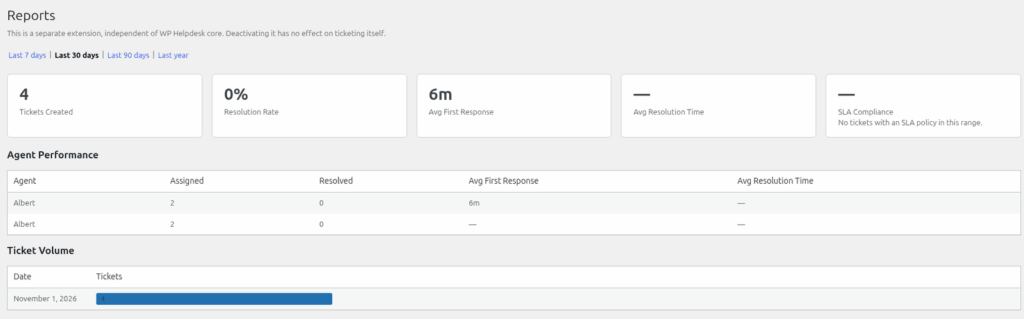
The Reports extension adds one page of figures: Helpdesk > Reports. It has summary cards and tables, not charts.
Pick a period at the top: "Last 7 days", "Last 30 days" (the default), "Last 90 days" or "Last year".
Summary cards
| Card | Meaning |
|---|---|
| Tickets Created | Tickets opened in the period. |
| Resolution Rate | The share of those tickets that are now Resolved or Closed. |
| Avg First Response | Average time to the first agent reply. |
| Avg Resolution Time | Average time to resolve. |
| SLA Compliance | The share of tickets with a stored SLA due date that met their targets. It needs the SLA extension. |
Agent Performance
A table with the columns Agent, Assigned, Resolved, Avg First Response and Avg Resolution Time. It lists up to 100 agents. "Resolved" counts tickets whose status is now Resolved or Closed, and "Assigned" uses the current assignment.
Ticket Volume
A table of tickets created each day, with a simple horizontal bar. It shows the latest 90 days of the period you chose.
Things to know
- Without the "View all tickets" permission, every figure covers only the tickets assigned to that person.
- Time tracking totals are not included.
- Because figures use each ticket's current status and assignment, a ticket you reassign moves to the new agent's row.
Still stuck? Open a ticket on the support page on ABC and a real person will help.
Was this article helpful?